

The picture most people have of data labeling
Ask someone to describe data labeling and you will usually get some version of this:
- Image: draw a box around the object.
- Audio: mark a start and end time stamp.
- Video: draw a box on every frame.
- Text: highlight a span and give it a tag.
- 3D: mark which voxels belong to which label.
None of this should be knocked. Getting good labels takes a lot of careful work, and the market reflects it. Grand View Research valued the data labeling solution and services market at $18.6 billion in 2024 and projects it will reach $57.6 billion by 2030, a 20.3% compound annual growth rate.
Notice what all five examples have in common, though. Each one treats a single file as the whole story: one file in, one set of annotations out.
The data is getting more complicated
As the market grows and AI advances, the data that needs labeling gets more complex. Two kinds of data tend to be called out as especially hard: 3D and time series. Broken down to their basic components, neither is as exotic as it sounds.
- 3D data is a series of 2D images. A volume or scene is a stack of slices or views. Label them with the right context and you have labeled the 3D object.
- Time series is a moment in time where multiple pieces of data are linked. A frame, a sensor reading, an audio segment, and a status log can all describe the same instant. The label belongs to the moment, not to any one file in it.
This article is about the second one, because it changes the question you ask. You stop asking “what is in this file?” and start asking “given everything we know about this moment, what is the right label?”
Companion files
At MLtwist, we handle this with the concept of companion files. A companion file is any additional data linked to the file being labeled. It can be:
- a labeling guideline
- metadata
- a satellite image
- another time series file
- any combination of the above
A single piece of data can have many companion files. The JSON that comes out of the labeling process then reads, in effect: for this file, these are the labels, based on all of this other data too.
That is what we mean by multi signal labeling. The labeler, the reviewer, and any AI helping with prelabels all see the same set of signals, and the output records the labels in that context.
The flexibility matters. Companion files can be brought in as static data, as 3D data, or as time series data, depending on what they are. The platform doesn’t need a different workflow for each.
What linked data looks like
Linked data shows up wherever raw, unstructured data is collected continuously and has to be tied together by something shared, such as an ID, a position, or a timestamp. Here are some common examples:
| Example | Unstructured data | How it’s linked |
|---|---|---|
| Radar object tracking | Radar detections, point clouds, signal signatures | Object ID, position, velocity, time |
| LiDAR sequences | 3D point clouds collected continuously | Timestamp, GPS, vehicle pose |
| Marine navigation | Radar scans, AIS messages, GPS tracks, sonar | Vessel ID, timestamp, geographic position |
| Aircraft navigation | Radar returns, ADS-B messages, flight trajectories | Aircraft ID, position, timestamp |
| Autonomous vehicle perception | Camera, radar, LiDAR, IMU and GPS streams | Sensor timestamps, vehicle pose, tracked object IDs |
| Satellite observation | SAR images, multispectral imagery, telemetry | Geographic footprint, acquisition timestamp |
One nuance: GPS, IMU, AIS, and ADS-B messages are often structured individually. They become part of a linked multimodal time series when they are associated with less structured data such as radar recordings, images, and point clouds.
Radar object tracking over time
A radar system collects sequential observations of the same physical environment:
- At T=0, the radar detects three objects.
- At T=100 ms, those objects have moved.
- At T=200 ms, one object becomes partially obscured.
- At T=300 ms, the system has to decide whether a new detection belongs to an existing track.
The linked data is raw radar frames, object detections, track IDs, velocity estimates, and potentially camera frames. The annotation work is to identify and track objects across frames, correct object associations, classify objects, and flag false positives.
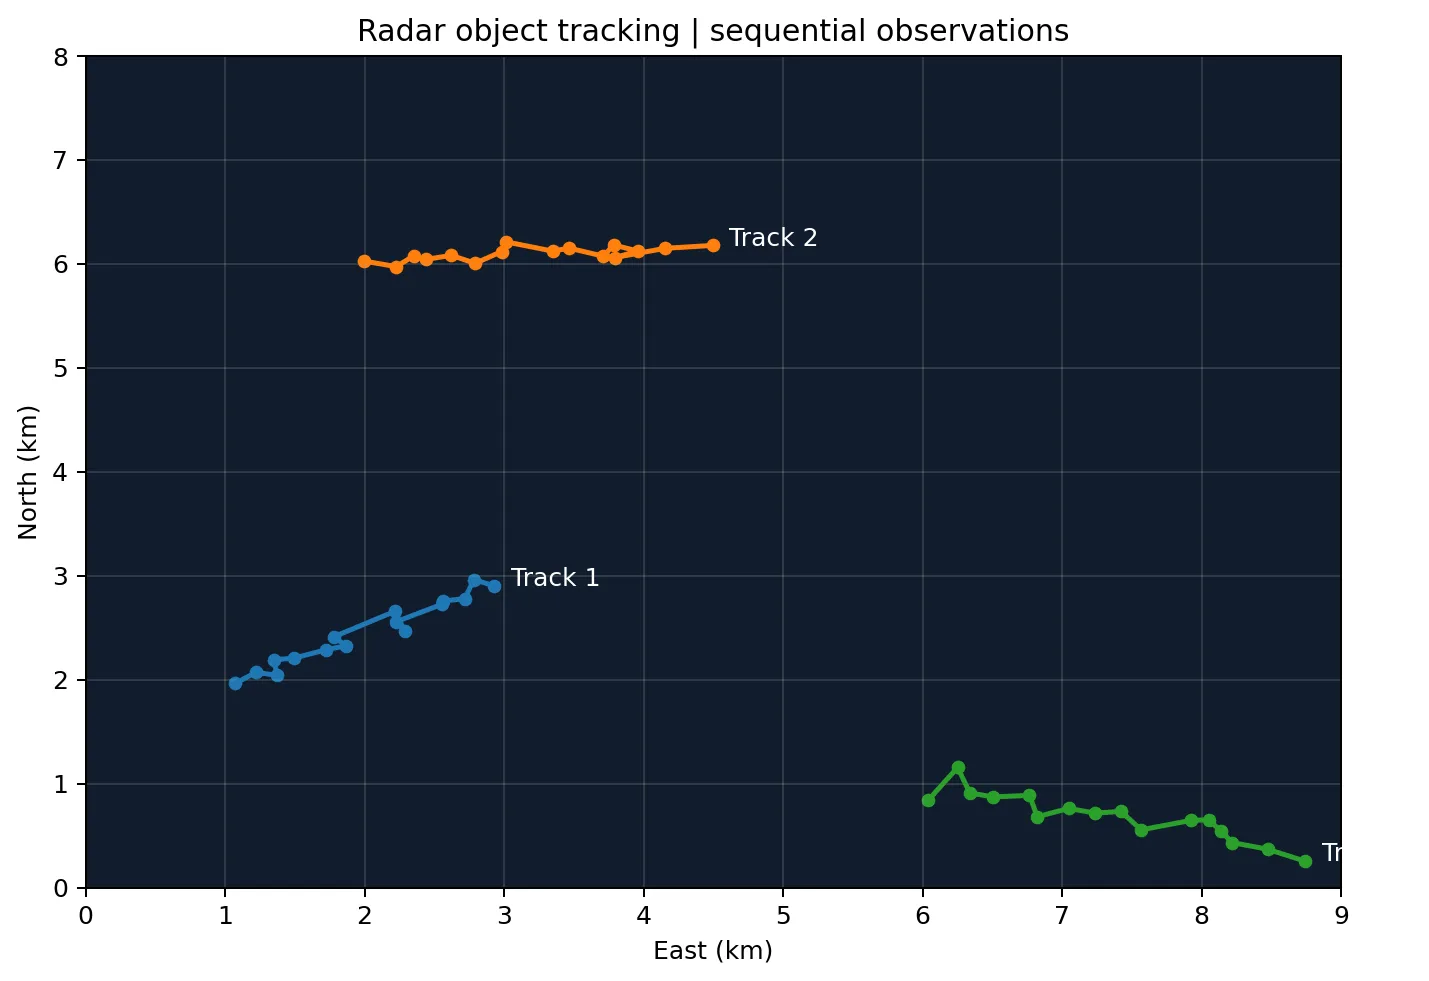
Synthetic example: three objects tracked across sequential radar observations.
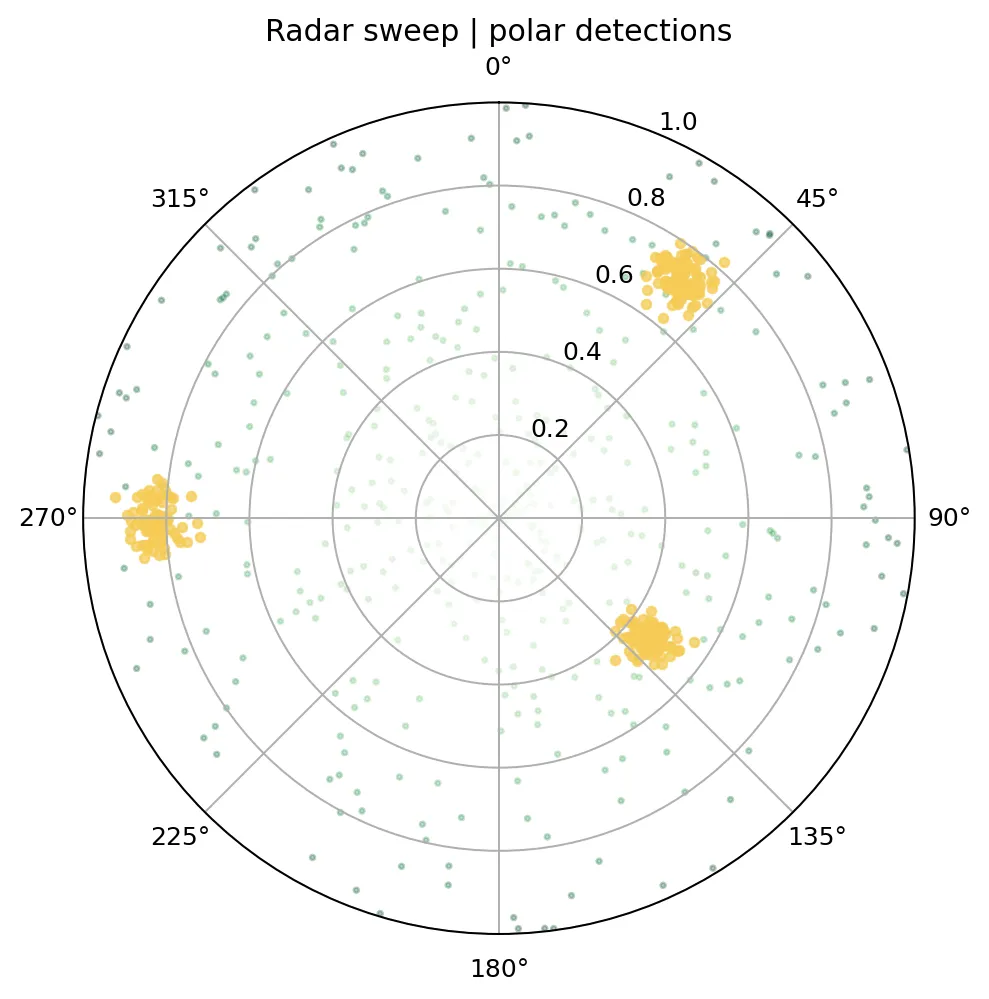
Synthetic example: a single radar sweep. Clusters of detections stand out from background noise.
Autonomous navigation with multiple sensors
An autonomous vehicle collects several streams at once, each at its own rate. These rates are illustrative:
| Sensor | Frequency | Data |
|---|---|---|
| Camera | 30 Hz | Images |
| Radar | 20 Hz | Radar frames |
| LiDAR | 10 Hz | Point clouds |
| IMU | 100 Hz | Motion readings |
| GPS | 1 to 10 Hz | Geographic coordinates |
The streams run at different frequencies and may use different coordinate systems. A pedestrian who appears in a camera frame at 12:00:01.200 has to be associated with the correct radar detection, the correct LiDAR points, and the vehicle’s position at that moment. The annotation work is cross sensor object association, temporal tracking, trajectory labeling, and finding places where the sensors disagree.
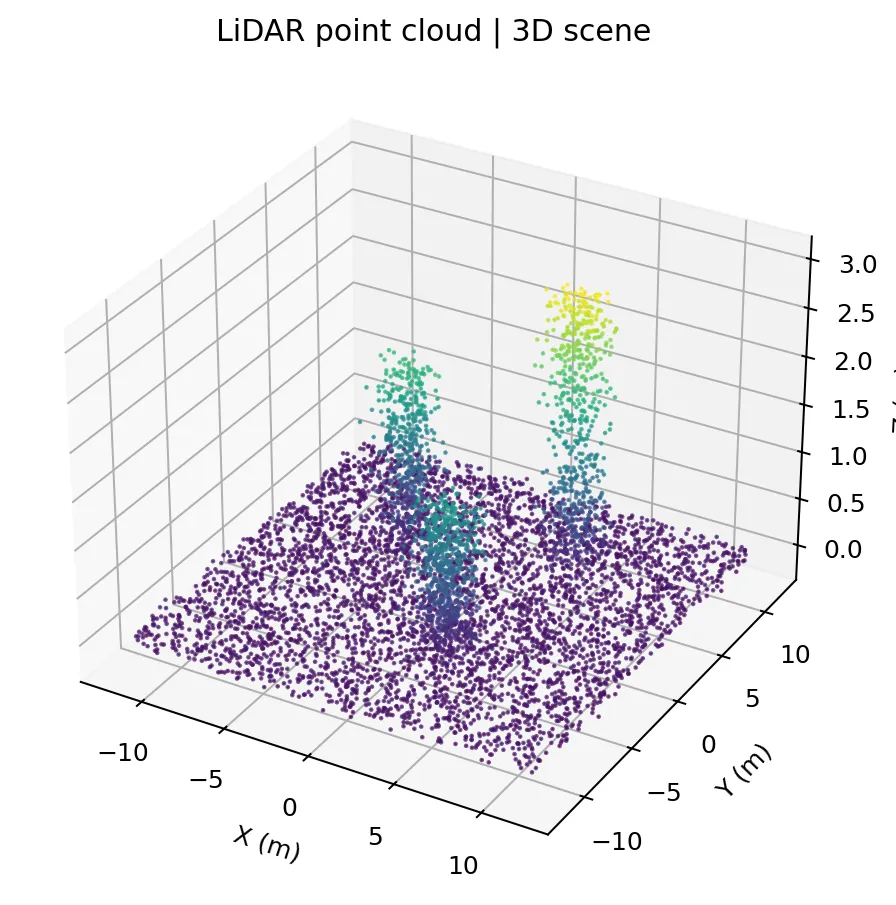
Synthetic example: a LiDAR point cloud of a scene.
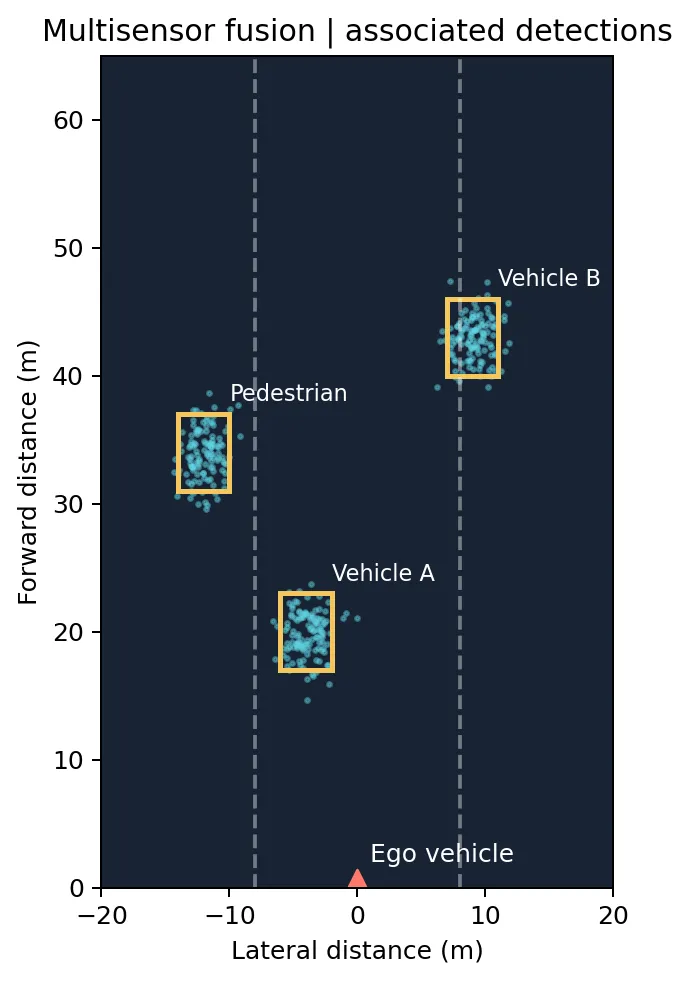
Synthetic example: detections from several sensors associated with the same pedestrian and vehicles.
Maritime radar and vessel navigation
A vessel can produce continuous streams of radar scans, GPS positions, AIS messages, camera images, and sonar readings, linked by time, location, and vessel identity. A small boat might appear in one radar scan and then be tracked across the next ones, while an AIS message provides an independent identification, or the absence of one. The annotation work is to distinguish boats from waves and clutter, match radar tracks to AIS targets, and label near collision events.
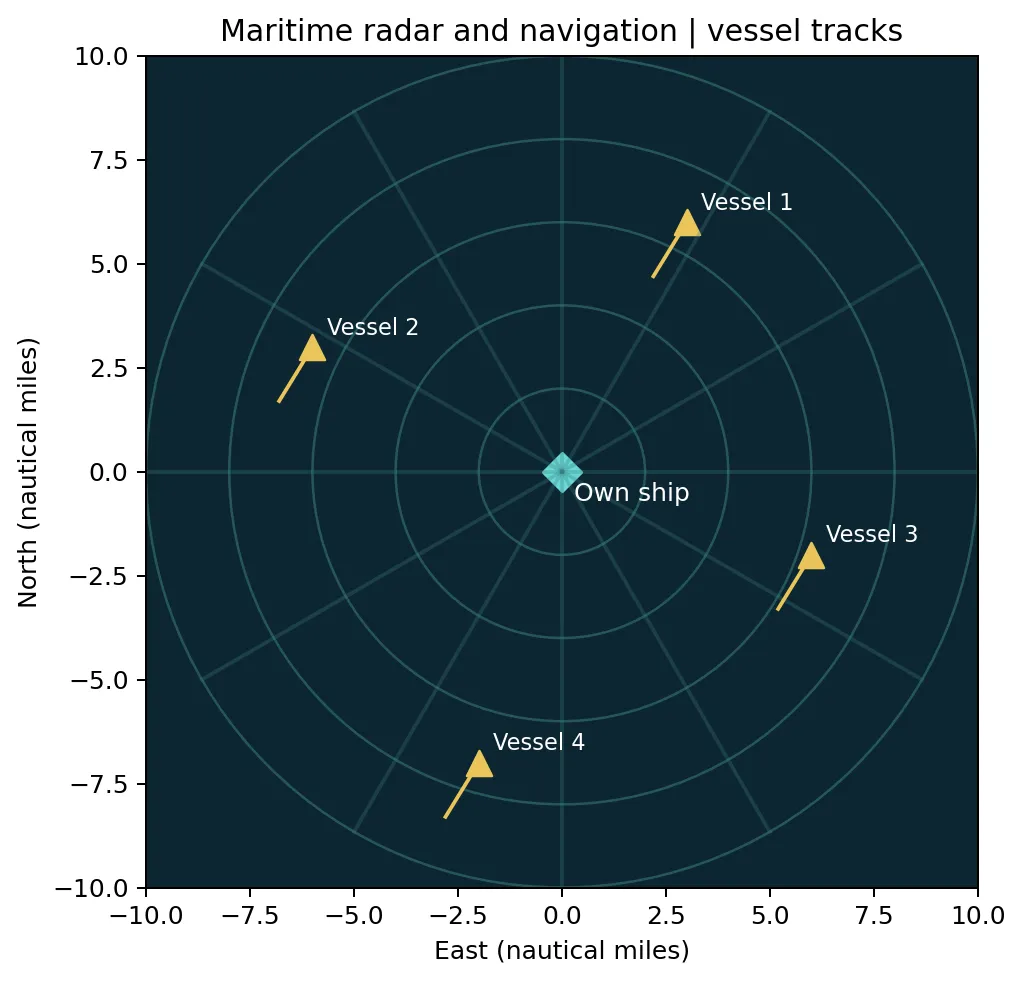
Synthetic example: four vessel tracks around an own ship on a maritime radar display.
The hard part is the relationships
In all three examples, the problem is rarely labeling any single file. It is preserving the relationships between files. That comes down to a few operations:
- Temporal synchronization. Align recordings that have different sampling frequencies and clock offsets.
- Spatial synchronization. Transform radar, camera, and LiDAR coordinates into a shared reference frame.
- Object continuity. Keep the same object identity across thousands of observations.
- Cross sensor validation. Decide whether observations from different sensors refer to the same real world object.
- Sequence level labeling. Annotate events that happen over time rather than inside a single frame.
This is also why linked unstructured time series isn’t the same as ordinary time series analytics. It needs a data operations platform that can keep the relationships between many different files, modalities, and time intervals intact.
Why a single file isn’t enough
A single file often can’t answer the question being asked. A few ways extra signals change the answer:
- Metadata changes what’s correct. The same image can need a different label depending on where, when, or by what it was captured.
- A second view resolves ambiguity. A ground level photo and a satellite image of the same place show different things. Together they settle what neither could alone.
- Time provides context. What happened a moment earlier, or what the sensor read at that instant, can change how a frame should be tagged.
- Guidelines are a signal too. Instructions that travel with the data keep labelers and reviewers working to the same definition of “right.”
When that context isn’t next to the file, people guess. The guesses end up in your data.
How teams usually get here
We rarely see a company start with a multi signal project. Typically, they start with a straightforward labeling requirement: one data type, one label set. Once that is under control, they begin adding signals and AI to improve quality, or to add label concepts that couldn’t be captured without them.
Each step is reasonable by itself. But if the labeling technology can only handle one file at a time, each step means a new tool, a new export, or a new workaround. The teams that planned for linked data from the start don’t have to rebuild.
The next frontier: synthetic time series
One of the next frontiers will be synthetic time series files linked to the data being labeled. Think of the examples above. A generated image or video of a scene could come with a synthetic radar track, a synthetic LiDAR sequence, or a synthetic GPS and vehicle pose stream, all tied to the same moments in time.
The challenge is the same one we described for synthetic images and video. Generating the signals is the easy part. Making sure they agree with each other is the hard part, because a camera frame, a radar return, and a position log that describe the same instant have to tell the same story. That takes people reviewing the linked set, not just each file alone. Companion files give those synthetic signals a place to live next to the data they belong to.
What this means for your team
We think multi signal labeling, with or without time series, is going to become table stakes. When you evaluate labeling technology, ask:
- Can it import multimodal data? Images, video, audio, text, 3D, time series, and metadata should all be supported, not only the data type you start with.
- Can it link files together? A file should be able to carry any number of companion files, in any combination.
- Do labelers and reviewers see the same signals? Context that only some people can see produces inconsistent labels.
- Does the output keep the context? The exported labels should record which signals they were based on, so the data can be traced and audited later.
- Can you add signals later? The project you start with won’t be the project you end up with.
Data labeling is still drawing boxes, marking time stamps, and tagging text. It is increasingly also about everything those labels depend on.
Learn more about data labeling at MLtwist, or get in touch about your multimodal data.